The intelligence layer that powers everything
Connect your code, docs, calls, and tools. Kasava builds a knowledge graph that gets smarter with every source — so every feature works better the more you use it.
Integrates with your favorite tools
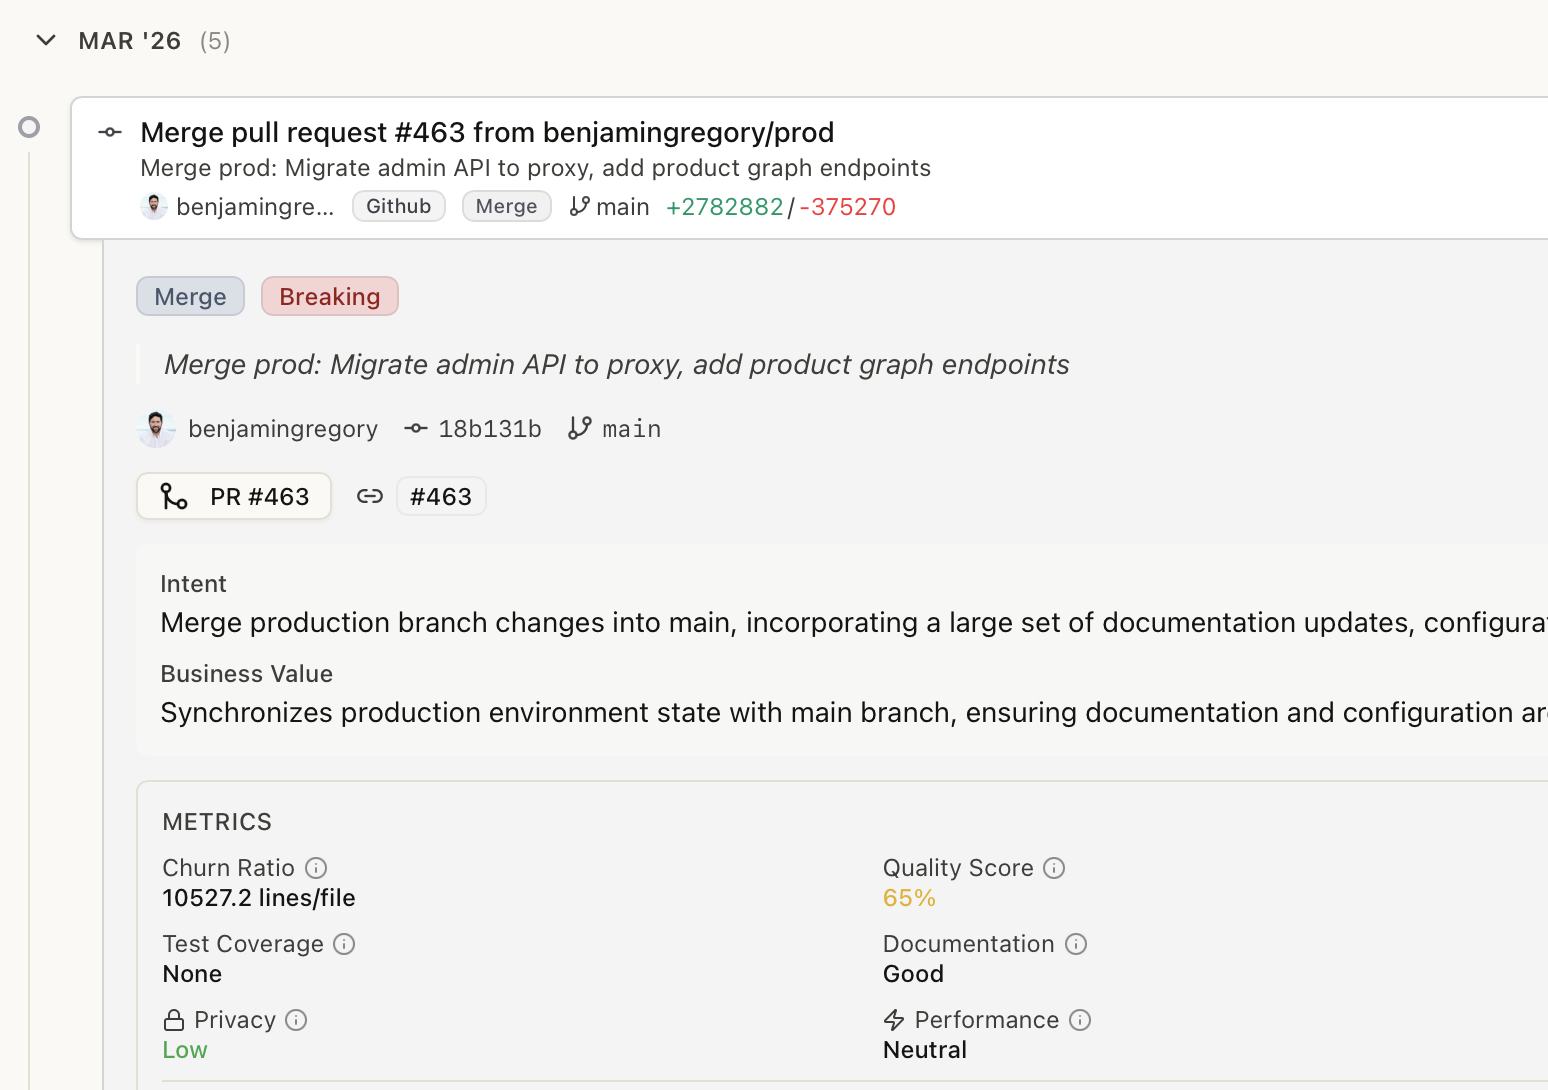
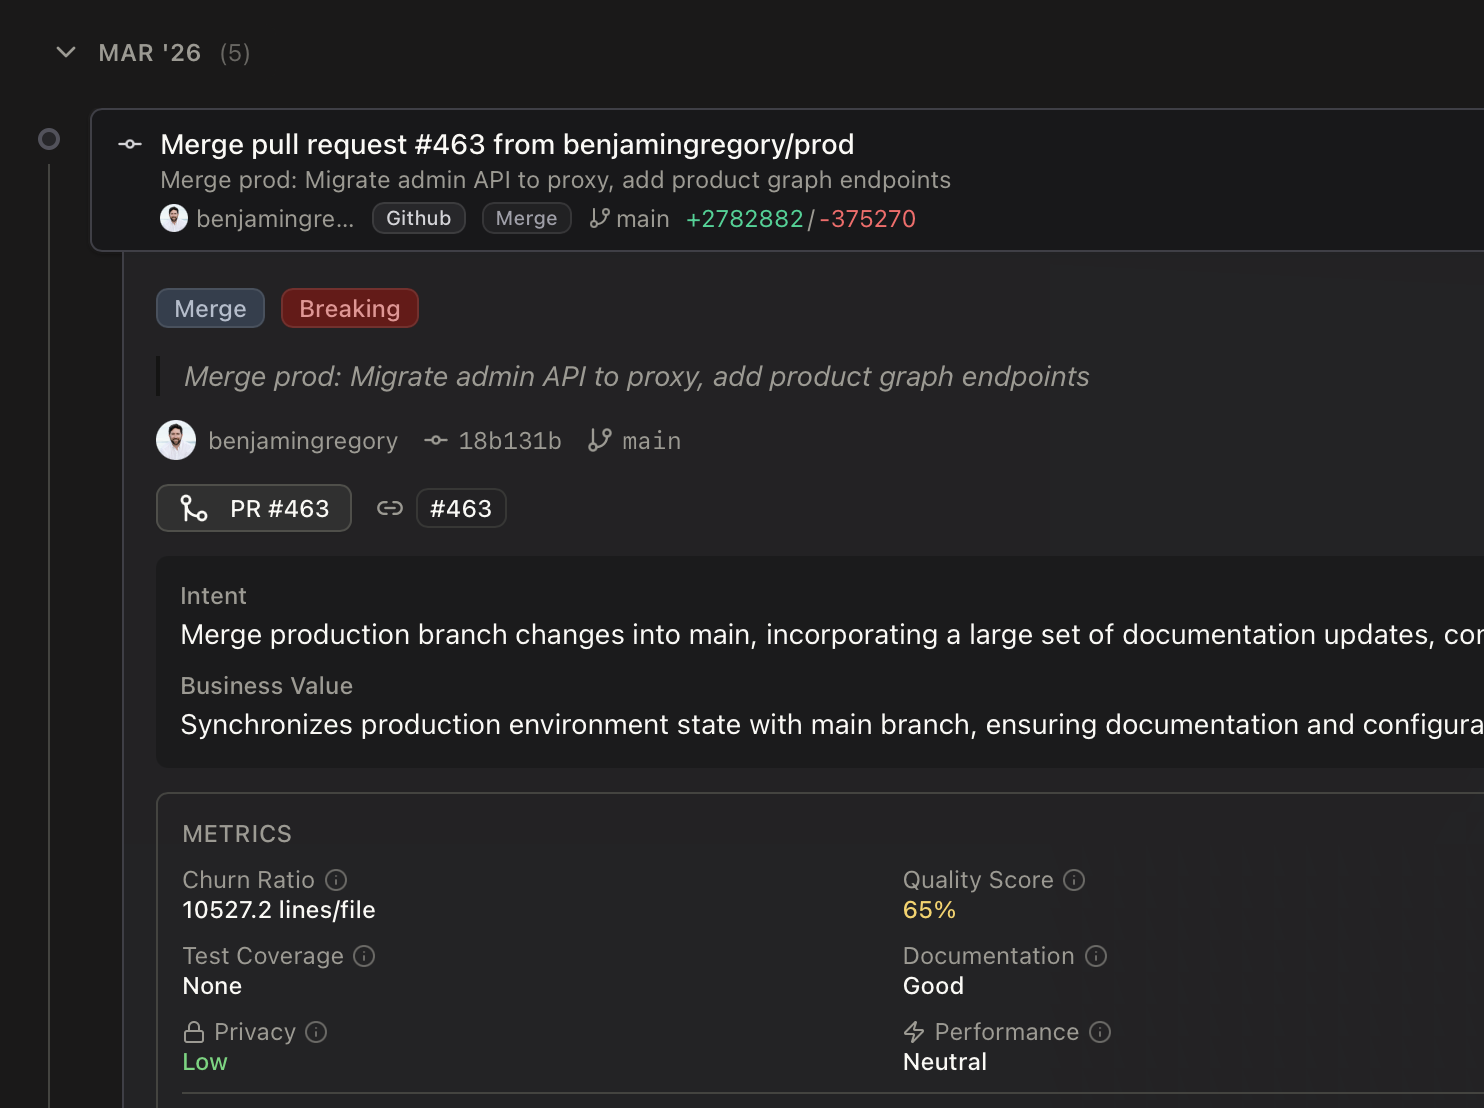
Every commit tells a story
PRs and commits analyzed for quality, complexity, and risk — so you see what's shipping, not just what's merging.
Automatic Discovery
Kasava automatically discovers patterns, components, and relationships across your codebase. No manual configuration needed.
Multi-Dimensional Taxonomy
Understand your product across multiple dimensions — architecture, features, teams, and customer impact.
Living Architecture Map
Visualize your product architecture and how components relate to each other with automatically maintained diagrams.
Health & Activity Tracking
Track the health and activity of every component in your product graph. Know what is actively maintained vs. what has drifted.
Ready to build your product graph?
Connect your sources and let AI power your entire product workflow — from chat to calls to plans.
No credit card required